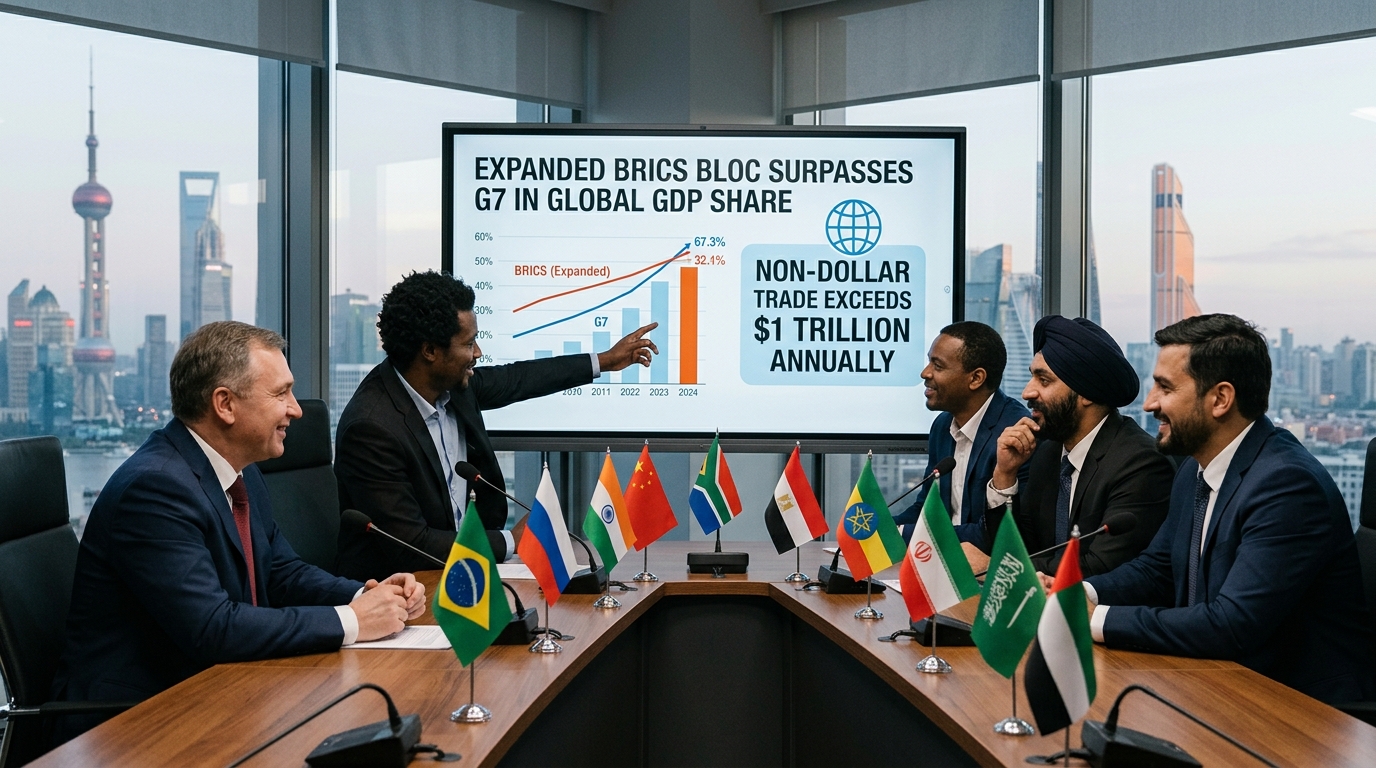
Expanded BRICS Bloc Surpasses G7 in Global GDP Share as Non-Dollar Trade Exceeds $1 Trillion
The Tectonic Pivot: Inside the $1 Trillion De-Dollarization Wave and the Changing Global Economic Balance
For nearly eight decades, the global economic architecture operated under a singular, unchallenged paradigm: the United States dollar served as the world’s financial baseline, and the Group of Seven (G7) industrialized nations dictated global macroeconomic policy.
That historical monopoly has officially met its match.
Data released by the International Monetary Fund (IMF) and international trade clearinghouses reveals a fundamental milestone: the expanded BRICS bloc now accounts for approximately 40% of global gross domestic product (GDP) based on Purchasing Power Parity (PPP), pushing the G7’s share down to roughly 28–29%. Binance
Even more striking than output figures is what is taking place across physical trade routes: non-dollar intra-bloc trade among BRICS members has quietly breached $1 trillion annually.
What began as a defensive alternative mechanism against Western economic sanctions has evolved into a self-sustaining financial ecosystem. As central banks from Asia to Latin America expand local-currency settlement rails and alternative payment messaging platforms, the world faces a pivotal question: Is this the dawn of a frictionless, multi-currency global trade architecture, or the beginning of a fractured monetary order?
To understand the scope of this global economic transition, we must look beyond diplomatic headlines and analyze verified transactional metrics, trade routes, and international reserve allocations.
The Power Shift by the Numbers
The expansion of BRICS—which grew from its core members (Brazil, Russia, India, China, and South Africa) to include key energy producers and emerging economies like Egypt, Ethiopia, Iran, the UAE, and Indonesia—fundamentally altered the bloc's global economic footprint.
- Output Inversion (PPP vs. Nominal): Adjusted for local purchasing power parity, the expanded BRICS economies represent a combined $88 trillion output compared to the G7’s $62 trillion. However, in current nominal U.S. dollar terms, the G7 maintains a lead, driven by the size of the U.S. financial system and European capital markets.
- The $1 Trillion Threshold: Driven by direct yuan-denominated commodity purchases, rupee-ruble energy settlements, and bilateral swap lines, non-dollar intra-BRICS trade surpassed $1 trillion by late 2025 and continues to grow.
- Energy Chokepoint Realignment: The addition of major Gulf energy suppliers means the expanded bloc now accounts for over 40% of global crude oil exports, giving its local-currency clearing systems structural backing in physical commodities.
The Settlement Mechanics: How the $1 Trillion Moves
Rather than replacing the dollar with a single unified currency, the bloc has focused on building interconnected alternative settlement infrastructure:
- Local-Currency Clearing: China and India conduct vast portions of their energy and raw material trades using the Yuan, Rupee, and Dirham, executing trades directly without clearing through New York correspondent banks. India Today
- Interbank Messaging Growth: China’s Cross-Border Interbank Payment System (CIPS) and independent messaging protocols have expanded rapidly, offering financial institutions an alternative to SWIFT for cross-border settlement.
- The Commodity Anchor: By settling energy trades in local currencies, importing nations reduce their need to hold vast U.S. dollar reserves simply to cover essential national fuel bills. BRICS Information Sharing & Exchanging Platform
Systemic Comparison: G7 vs. Expanded BRICS
| Dimension / Indicator | Group of Seven (G7) | Expanded BRICS Bloc |
| Share of Global GDP (PPP) | ~28% – 29% | ~40% |
| Share of Global Population | ~10% | ~45% – 50% |
| Dominant Settlement Currency | U.S. Dollar (USD), Euro (EUR) | Yuan (RMB), Local Currency Swaps |
| Primary Financial Clearing | SWIFT, Federal Reserve Fedwire | CIPS, Local Central Bank Swaps, mBridge |
| Commodity Leverage | Consumption & Technology Services | Raw Materials, Energy, Agriculture, Manufacturing |
As non-dollar clearing mechanisms achieve critical mass, economists and global macro strategists are assessing how this structural split will re-shape international trade and reserve asset management.
Note: The following scenarios represent market sentiment, structural modeling, and speculative macro projections rather than guaranteed outcomes.
Scenario A: The Bipolar Trade Equilibrium (Estimated Probability: ~50%)
- The Hypothesis: The global financial system formalizes into a stable two-pillar system. Western economies continue to trade overwhelmingly via dollar and euro rails, while emerging markets execute bilateral raw material and industrial trades using CIPS and local digital currencies.
- Market Sentiment Impact: Global central banks shift reserve allocations, holding a lower percentage of paper U.S. Treasuries and increasing allocations toward gold, physical commodities, and local sovereign debt.
Scenario B: The Fragmentation Friction Model (Estimated Probability: ~35%)
- The Hypothesis: Rapid de-dollarization outpaces the development of secondary liquidity markets for non-dollar currencies. Businesses face currency conversion friction, higher hedging costs, and balance-of-payment mismatches when trading outside the U.S. dollar standard.
- Market Sentiment Impact: Commodity trade flourishes within closed bilateral loops, but broader international capital mobility becomes more complex and fragmented.
Scenario C: Western Financial Re-Entrenchment (Estimated Probability: ~15%)
- The Hypothesis: Deep capital market liquidity, unmatched institutional legal protections, and high GDP per capita across G7 nations maintain the U.S. dollar's primary role as the global reserve asset of choice despite shifting trade volumes.
- Market Sentiment Impact: Local-currency trade settles at a high plateau, but primary pricing benchmarks for energy, metals, and agricultural goods remain anchored in U.S. dollars.
The crossover in purchasing power and the $1 trillion non-dollar trade benchmark represent a turning point in modern economic history. While the U.S. dollar remains deeply entrenched in global capital markets and central bank reserves, the physical trade of real goods—energy, food, and manufactured commodities—is increasingly bypassing Western clearing infrastructure.
For policymakers, corporate treasurers, and global investors, three key variables will define the next phase of this financial transition:
- Cross-Border Interoperability: Track the adoption speed of multi-CBDC platforms like project mBridge and the expansion of CIPS direct participants.
- Pricing Benchmark Denomination: Observe whether global benchmarks for crude oil, natural gas, and critical minerals transition to local currencies or remain dollar-denominated.
- Central Bank Reserve Trends: Monitor quarterly IMF COFER data to see if central banks in the Global South accelerate their diversification out of paper Western debt and into hard assets like gold.
The global economy is no longer operating under a single financial roof. Understanding how these parallel monetary networks interact will be the defining challenge for business leaders and macro strategists in the decade ahead.
BRICS Is Now Bigger Than the G7
This video provides an analytical breakdown of how the expanded BRICS bloc surpassed the G7 in purchasing power parity and what this shift means for the global financial architecture.